Top 7 YouTube Courses on Data Analytics
Learn data analytics by taking the best YouTube courses. These courses will cover data analysis with Python, R, SQL, PowerBI, Tableau, Excel, and SPSS.

Image by author
Data analysis is the process of understanding the data by performing various statistical analyses. The data visualization and analysis can provide crucial insight that can be beneficial for a company or the whole industry. Most companies are making profits by making data-driven decisions, and they are paying big bucks to hire qualified data analysts.
In this blog, we will go through the top seven data analytics courses on YouTube. These courses were selected on the quality of content, popularity, and project-based learning. Working on a real-life project can provide you with a clear idea about the career path. These courses range from beginner to intermediate, and they all are freely available on YouTube with project resources.
Data Analysis with Python: Zero to Pandas
Duration: 12 - 20 hr | Level: Beginner - Intermediate | Quality: 4.25/5
Python is the most popular language in the world of data science, and a majority of data analysts use it to process and visualize data. Data Analysis with Python course is for beginners, as it teaches you the basics of Python programming and explains data manipulation and visualization tools in detail. The course includes; Jupyter notebook fundamentals, Numpy for data processing, Pandas for data manipulation, data visualization with Matplotlib & Seaborn, and exploratory data analysis case study.
Data Analytics Using R For Beginners
Duration: 1 - 2 hr | Level: Beginner | Quality: 3.75/5
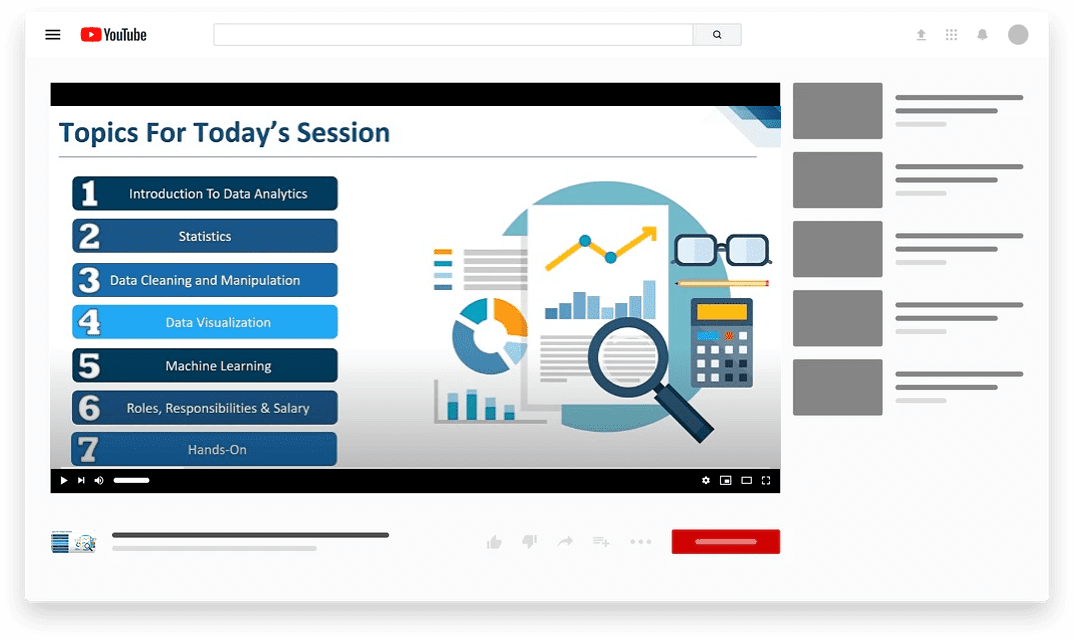
Data Analytics For Beginners by Edureka is a quick introduction to the world of R and data analytics. R is also one of the popular languages to perform statistical tasks, and it is slowly becoming a go-to tool for performing all data science tasks. The course includes; an introduction to data analytics, statistics, data cleaning and manipulation, data visualization, machine learning, responsibilities of a data analyst, and finally, hands-on learning by working on a project. The first half is a descriptive introduction of various terminologies used in data analytics, and the last part is all about coding. It is advised to code along and debug the error as you go. You can pause or rewind multiple times to understand the concept properly.

Image by autor | Data Analytics For Beginners
SQL & Data Analytics for Beginners
Duration: 3 - 5 hr | Level: Beginner - Intermediate | Quality: 4/5
SQL & Data Analytics for Beginners by DataDash is an in-depth course on Postgresql and how to use SQL queries to analyze the data. The second part of the course is all about Tableau: importing the dataset, visualizing, and creating a dashboard. The first part of the course includes; setting up the server, setting up a database, SQL syntax, importing & exporting data. The second part of the course includes everything about tableau from creating interactive maps to forecasting. This course is highly recommended as SQL is a highly in demand skill in the tech industry. You cannot get a data analytics job without the knowledge about SQL.
Data Analysis Project in Power BI & Tableau
Duration: 7- 10 hr | Level: Beginner - Intermediate | Quality: 4.25/5
Data Analysis Project by codebasics is a project-based course where you will learn how data analysis projects are executed in big companies. The project is about a computer hardware company that is struggling to compete in a dynamic market. Your main goal is to create a dashboard for higher management, so they can monitor real-time sales. In the first part, you will use Power BI to learn data discovery, data analysis using SQL, data learning & ETL, build a dashboard, feedback from stakeholders, publish the report, and access the dashboard in a mobile application. In the second, you will use Tableau to perform all of the above tasks.

Image by author | Data Analysis Project
Tableau for Data Visualization
Duration: 0.5 - 2 hr | Level: Beginner | Quality: 3.5/5
Tableau for Data Visualization by freecodecamp is a mini-course that covers all essential steps in creating a data analysis Tableau report. The project is using the famous Titanic dataset from Kaggle to create interactive visualization and explore the dataset. The course includes data ingestion, a simple bar chart, customizing chart, creating a complex bar chart, and creating a report with multiple plots. Tableau for Data Visualization is light and beginner-friendly.
Data Analytics in Excel
Duration: 4 - 7 hr | Level: Beginner - Intermediate | Quality: 3.75/5
Data Analytics In Excel by Simplelearn introduces you to toolpak and Excel functions such as vlookup, hlookup, sumif/s, counif/s, and iferror. The majority of companies are still using Excel sheets to perform all data tasks, from maintaining the database to forecasting the sales. In this course, you will learn the basics of Excel, lookup & functions, conditional formatting, sorting & filtering, and data analysis using toolpak.
SPSS for Beginners
Duration: 2 - 5 hr | Level: Intermediate | Quality: 3.75/5
SPSS for Beginners by Datalab gives you a gentle introduction to the statistical analysis tool SPSS and how you can use it to create interactive data analytics. SPSS was the most popular statistical tool used by academic researchers in 2015 and even though it has fallen significantly in popularity, the tool is widely used in large corporations such as Zendesk, Lewis, Inc, and Federal Emergency Management Agency. The course covers Graph board templates, bar charts, histograms, scatterplots, frequencies, descriptives, labels & definitions, entering data, importing data, hierarchical clustering, factor analysis, and regression.

Image by author | SPSS for Beginners | Mockup by crowf
Opinion
Go through all of the courses and try to replicate each step on your local machine. Code along can help you learn faster, and you might even come up with a better solution for performing the same task. The blog gives you a complete introduction to the most popular tools used in the industry. Learning multiple skills can also increase your chances of getting hired by your dream company.
Abid Ali Awan (@1abidaliawan) is a certified data scientist professional who loves building machine learning models. Currently, he is focusing on content creation and writing technical blogs on machine learning and data science technologies. Abid holds a Master's degree in Technology Management and a bachelor's degree in Telecommunication Engineering. His vision is to build an AI product using a graph neural network for students struggling with mental illness.
