How to Setup Julia on Jupyter Notebook
Learn three simple steps to install Julia for Jupyter Notebook and write your first data visualization code.

Image by Author
Julia is a high-level, general-purpose language that is designed for high-performance calculation. It is getting popular among the data community and researchers due to natural language syntax, faster code execution, and a strong machine learning ecosystem.
Due to the popularity of the integrated notebooks, data scientists and researchers are now running Python, R, Bash, Scala, Ruby, and SQL on the Jupyter Notebook. And now, we will learn to install the Julia and set it up for the Jupyter notebook. Furthermore, we will load a CSV file and perform time series data visualization.
Setting Up Julia on Jupyter Notebook
Julia can be used by running code in a REPL or executing the `.jl` file, but running the code in a Jupyter notebook gives us more control over experimentation. You can perform data analysis, train machine learning models, or even create a Julia package using the notebook.
Step 1: Download and Install the package
You can download and install the current stable release of Julia by visiting the official website. The stable release is available for Windows, Linux, and macOS.
It took me a few minutes to download and install Julia for Windows. To run Julia REPL, you type “julia” in PowerShell, Terminal, or Bash. You can also find the Julia icon at the start and click on it to start the REPL.
Step 2: Install IJulia
To integrate Julia with Jupyter Notebook, you need to install the Ijulia package.
In the Julia REPL, type:
using Pkg
Pkg.add("IJulia")

Image by Author | Julia REPL
You can also install the Julia package by typing “]” to enter in the package menu. After that type `add Ijulia` to install the package.

Image by Author | Installing Ijulia
Step 3: Running the Julia in Jupyter Notebook
We are now ready to use Jupyter Notebook. Launch the Jupyter notebook, click on the New button and select the Julia environment.

Image by Author | Jupyter Notebook
For VSCode, create a new Jupyter Notebook file and change the Kernel from Python to Julia by clicking on the Kernel name as shown below.
We now have R, Python, and Julia environments. You can switch between them based on your requirements.

Image by Author | VScode Jupyter Notebook
Getting Started with Julia
After installing Julia, let’s write a simple code to print the text. Just like Python, it executed the command smoothly.

Image by Author | Code execution on Jupyter Notebook
print("Visit KDnuggets.com for more cheat sheets and additional learning resources.")

>>> Visit KDnuggets.com for more cheat sheets and additional learning resources.
Installing Packages
You can install any Julia package within the Juypter cell by typing `using Pkg` and `Pkg.add(<Package Name>)` .
We will be installing DataFrame, CSV, Plots, PyPlot, and RollingFunctions.
using Pkg

Pkg.add("DataFrames")
Pkg.add("CSV")
Pkg.add("Plots")
Pkg.add("PyPlot")
Pkg.add("RollingFunctions")
Reading CSV file
To access the package, you need to type `using` and then type all the package names separated by comma “,”.
Next, we are going to download US covid tracking data and save the CSV file as “covid_us.csv”.
Then, we will use `CSV.read` to read the CSV file and convert it into DataFrame. We will select only two columns “date” and “totalTestResultsIncrease'', and change the date format.
In the end, we will:
- Filter the results to remove negative values
- Sort the dataframe in ascending order
- Display the last 5 rows.
using Downloads, DataFrames, CSV, Plots, Dates

download_covid = Downloads.download("https://api.covidtracking.com/v1/us/daily.csv",
                                    "covid_us.csv")
columns = [:date, :totalTestResultsIncrease]
fmt = "yyyymmdd"
t = Dict(:date=>Date)

covid_df = CSV.read("covid_us.csv",
                    DataFrame,
                    dateformat=fmt,
                    select=columns,
                    types=t)

covid_df = sort(filter(row -> row.totalTestResultsIncrease > 0, covid_df))
last(covid_df,5)

Data Visualization with Plot and RollingFunctions
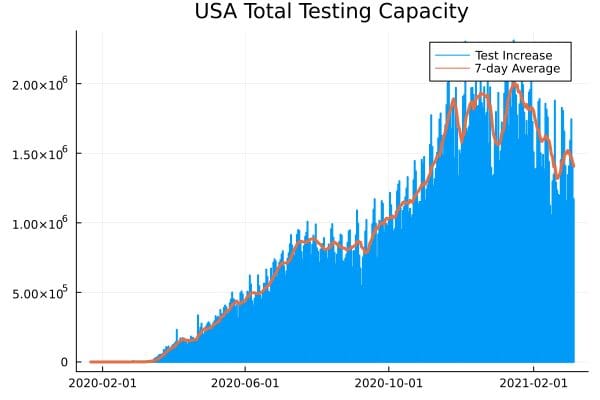
I have modified Jonathan Dinu’s code to display the USA total testing capacity bar chart.
We will be using Plot.jl to display sticks/bar charts and RollingFunctions.jl to get a 7 day average of total test results.
using RollingFunctions

# plot daily test increase as sticks
Plots.plot(covid_df.date,
    covid_df.totalTestResultsIncrease,
    seriestype=:sticks,
    label="Test Increase",
    title = "USA Total Testing Capacity",
    lw = 2)

# 7-day average using rolling mean
window = 7
average = rollmean(covid_df.totalTestResultsIncrease, window)

# we mutate the existing plot
Plots.plot!(covid_df.date,
    cat(zeros(window - 1), average, dims=1),
    label="7-day Average",
    lw=3)

This is awesome.
You can easily find alternative Python and R data analytics packages in Julia by visiting Julia Packages webpage.
Conclusion
Julia is easy to use, and the code execution is faster than Python. If you are transitioning from R and Matlab to Julia, the syntax and package ecosystem will feel natural for you to adopt.
It is a general-purpose language, and recently it has started attracting the machine-learning community due to native packages that are totally built on Julia to provide faster training and inference time.
If you have any questions regarding Julia, do ask me in the comments. You can also join the Julia community on Slack, Discord, and Discourse to learn more about the latest developments.
Abid Ali Awan (@1abidaliawan) is a certified data scientist professional who loves building machine learning models. Currently, he is focusing on content creation and writing technical blogs on machine learning and data science technologies. Abid holds a Master's degree in Technology Management and a bachelor's degree in Telecommunication Engineering. His vision is to build an AI product using a graph neural network for students struggling with mental illness.
