Make Amazing Visualizations with Python Graph Gallery
Use the hundreds of charts made on Python Graph Gallery to help you make your visualization.
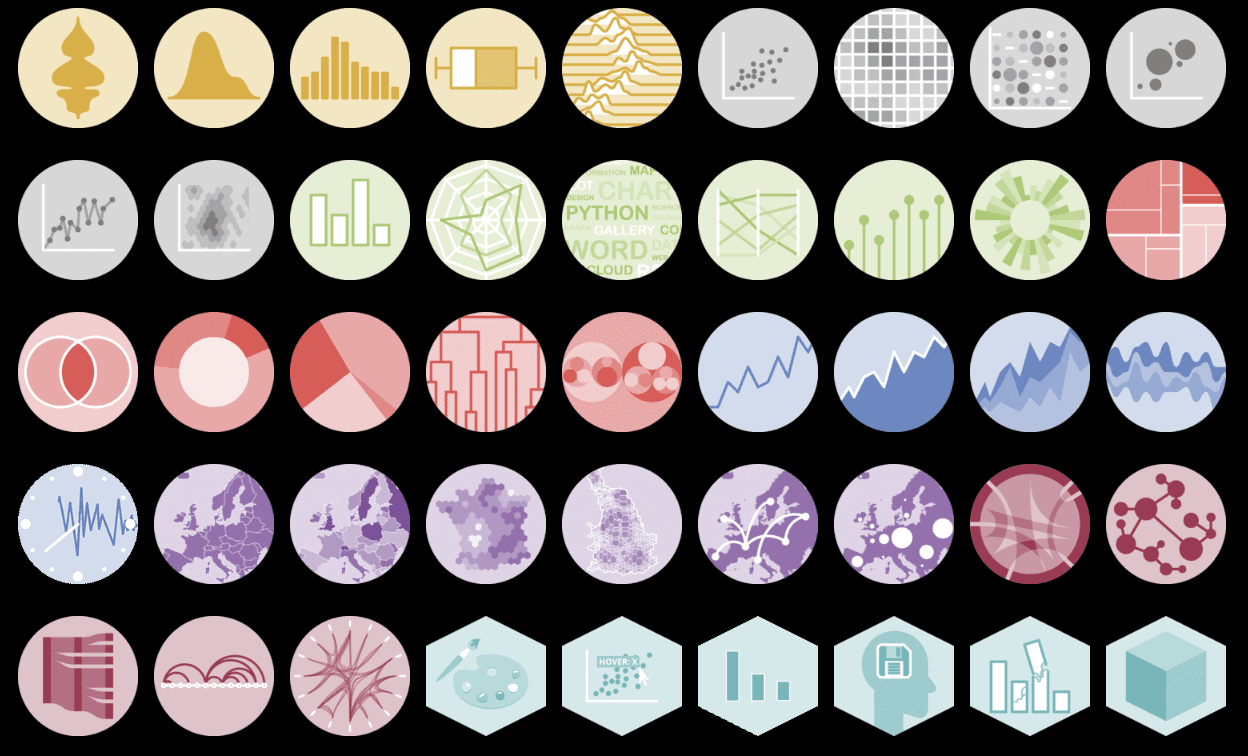
Screenshot from Python Graph Gallery
If you’re looking to make your data look better, look no further. Python Graph Gallery has a collection of around 400 charts which are organized into 40 different categories. All the categories come with multiple examples and reproducible code and with some explanation.
Prerequisites
To take full advantage of this free resource, it will be useful to have a working knowledge of the following tools:
- Matplotlib
- Seaborn
- Plotly
If you don’t have the best knowledge of these tools, below are their official documentations and tutorials to help you:
If you need further resources, give the following a try:
- Data Visualization in Python (Mplib, Seaborn, Plotly, Dash) - Udemy
- Matplotlib Tutorial - YouTube
- Seaborn Tutorial - YouTube
- Plotly Tutorial - YouTube
Once you have a good grasp of these tools, you can apply them to create beautiful visualizations, as shown below.
Example Visualisation
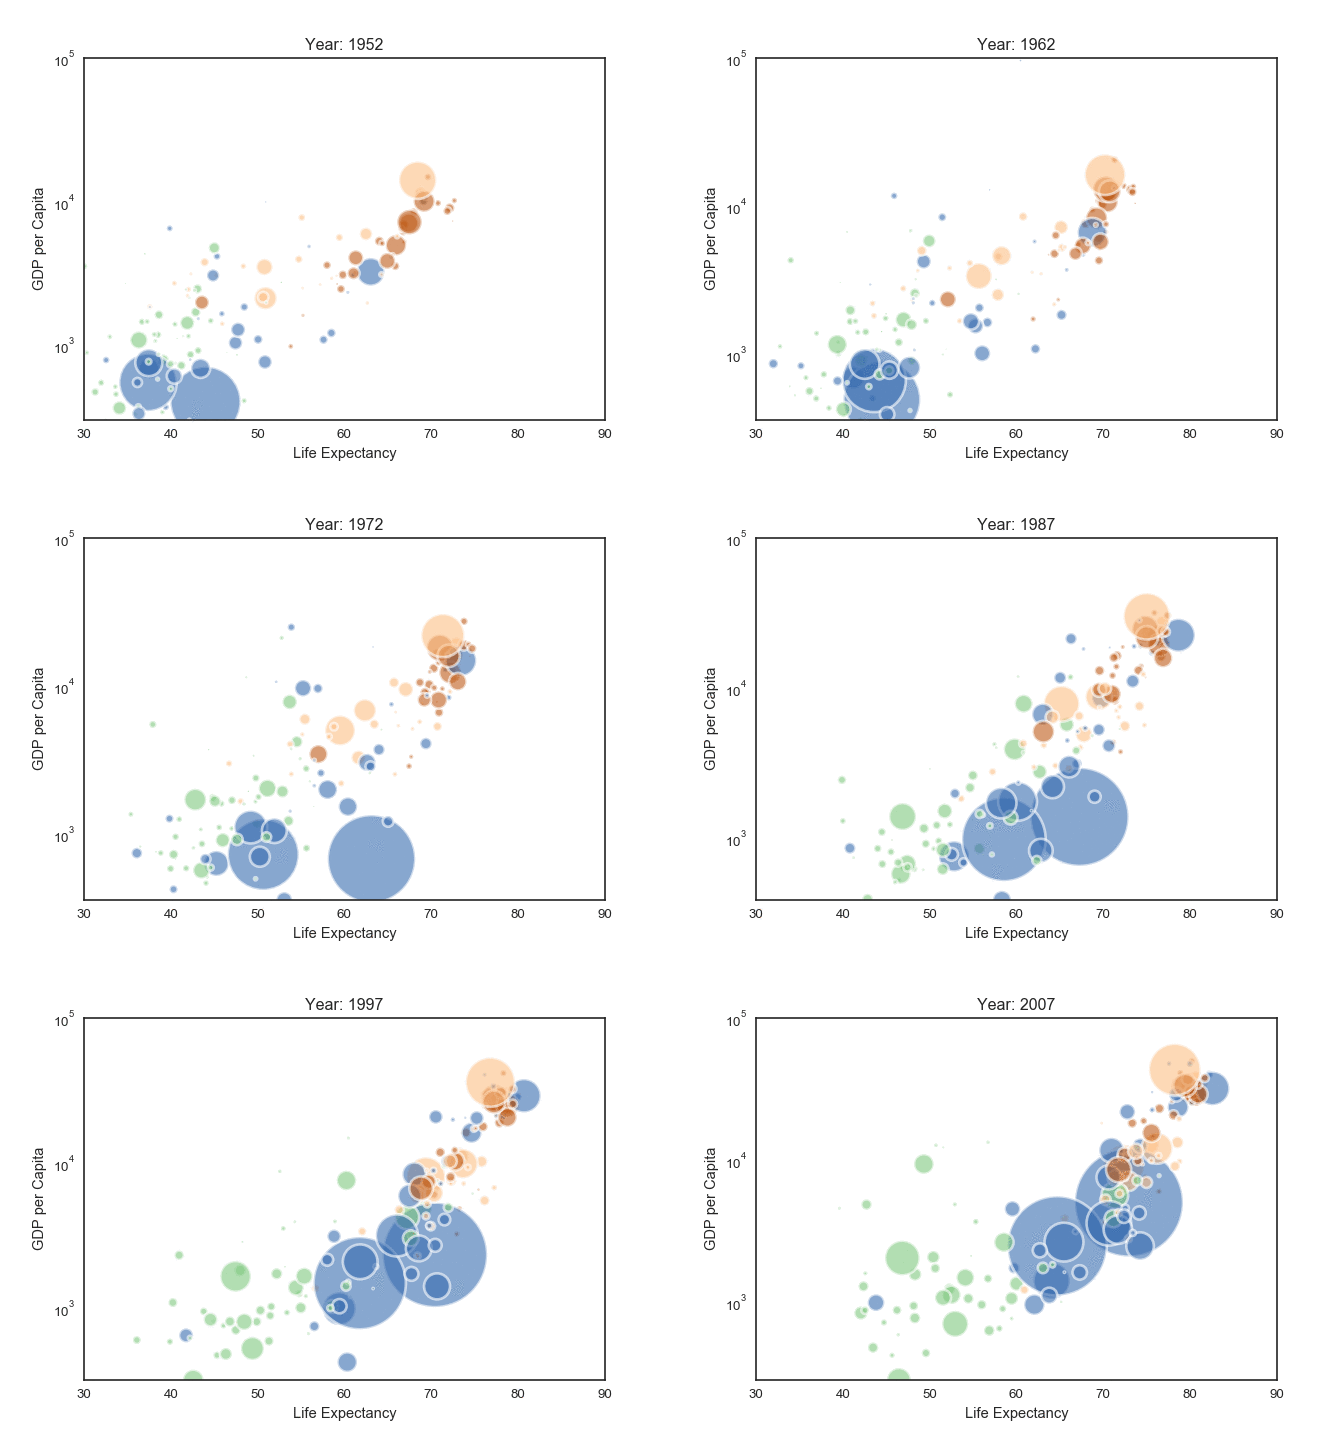
Animated bubble chart
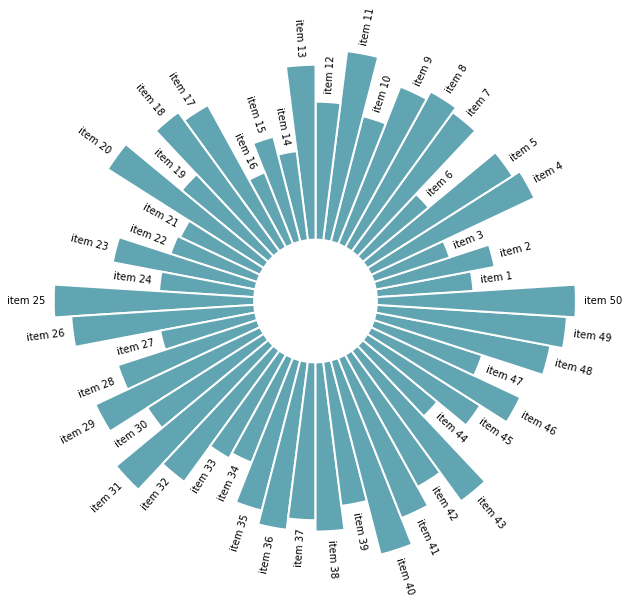
Basic circular barplot
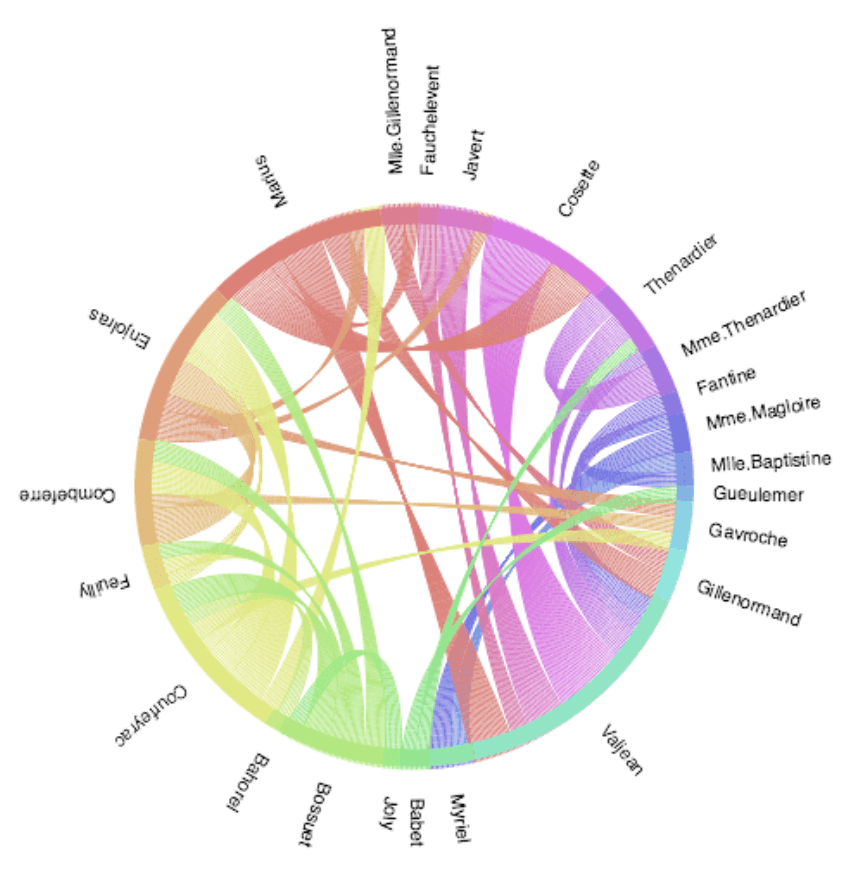
Chord Diagram
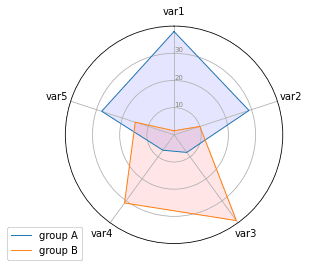
Radar chart
Conclusion
Data visualization is the best way of presenting your work. Explaining data can be a challenge. However, the majority of people can appreciate visualizations. Visualizations are easy to explain to understand. Being able to create amazing visualizations is a skill that every data scientist should acquire, and Python Graph Gallery helps with this.
Nisha Arya is a Data Scientist and Freelance Technical Writer. She is particularly interested in providing Data Science career advice or tutorials and theory-based knowledge about Data Science. She also wishes to explore the different ways Artificial Intelligence is/can benefit the longevity of human life. A keen learner, seeking to broaden her tech knowledge and writing skills, whilst helping guide others.
