Introduction to Trainspotting: Computer Vision, Caltrain, and Predictive Analytics
We previously analyzed delays using Caltrain’s real-time API to improve arrival predictions, and we have modeled the sounds of passing trains to tell them apart. In this post we’ll start looking at the nuts and bolts of making our Caltrain work possible.
By Chloe Mawer, Colin Higgins & Matthew Rubashkin, Silicon Valley Data Science.
Here at Silicon Valley Data Science, we have a slight obsession with the Caltrain. Our interest stems from the fact that half of our employees rely on the Caltrain to get to work each day. We also want to give back to the community, and we love when we can do that with data. In addition to helping clients build robust data systems or use data to solve business challenges, we like to work on R&D projects to explore technologies and experiment with new algorithms, hypotheses, and ideas. We previously analyzed delays using Caltrain’s real-time API to improve arrival predictions, and we have modeled the sounds of passing trains to tell them apart. In this post we’ll start looking at the nuts and bolts of making our Caltrain work possible.
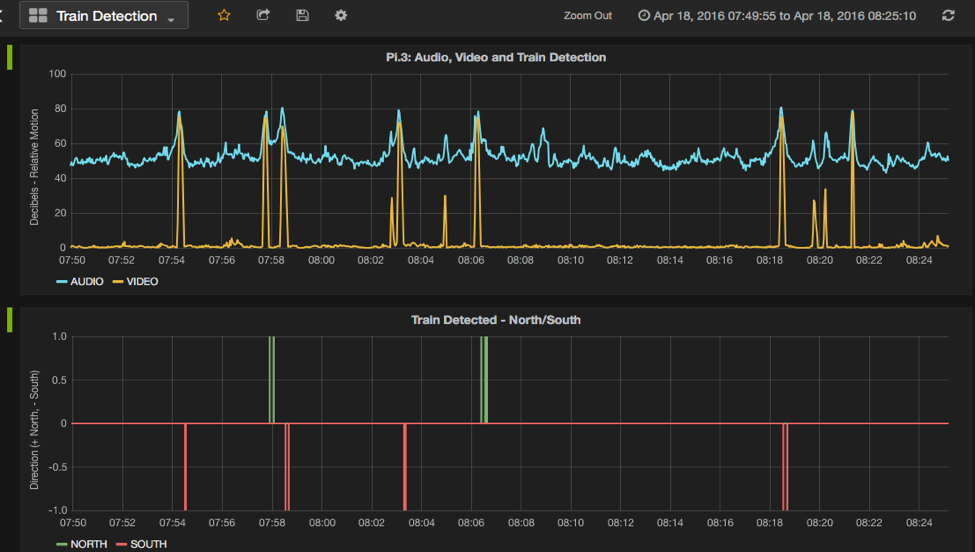
If you have ever ridden the train, you know that the delay estimates Caltrain provides can be a bit... off. Sometimes a train will remain “two minutes delayed” for ten minutes after the train was already supposed to have departed, or delays will be reported when the train is on time. The idea for Trainspotting came from our desire to integrate new data sources for delay prediction beyond scraping Caltrain’s API . Since we had previously set up a Raspberry Pi to analyze train whistles, we thought it would be fun to validate the data coming from the Caltrain API by capturing real-time video and audio of trains passing by our office near the Mountain View station.
There were several questions we wanted our IoT Raspberry Pi train detector to answer:
- Is there a train passing?
- Which direction is it going?
- How fast is the train moving?
Sound alone is pretty good at answering the first question because trains are rather loud. To help answer the rest of the questions, we added a camera to our Raspberry Pi to capture video.
We’ll describe this process in a series of posts. They will focus on:
- Introduction to Trainspotting (you are here)
- Image Processing in Python
- Streaming Video Analysis with Python
- Streaming Audio Analysis and Sensor Fusion
- Recognizing Images on a Raspberry Pi
- Connecting an IoT device to the Cloud
- Building a Deployable IoT Device
Let’s quickly look at what these pieces will cover.
Walking through Trainspotting
In the upcoming “Image Processing in Python” post, Data Scientist Chloe Mawer demonstrates how to use open-source Python libraries to process images and videos for detecting trains and their direction using OpenCV. You can also see her recent talk from PyCon 2016.
In “Streaming Video Analysis with Python,” Data Scientist Colin Higgins and Data Engineer Matt Rubashkin describe the steps to take the video analysis to the next level: implementing streaming, on-Pi video analysis with multithreading, and light/dark adaptation. The figure below gives a peek into some of the challenges in detecting trains in varied light conditions.
In a previous post mentioned above, Listening to Caltrain, we analyzed frequency profiles to discriminate between local and express trains passing our Sunnyvale office. Since that post, SVDS has grown and moved to Mountain View. Since the move, we found that the pattern of train sounds was different in the new location, so we needed a more flexible approach. In “Streaming Audio Analysis and Sensor Fusion,” Colin describes the audio processing and a custom sensor fusion architecture that controls both video and audio.
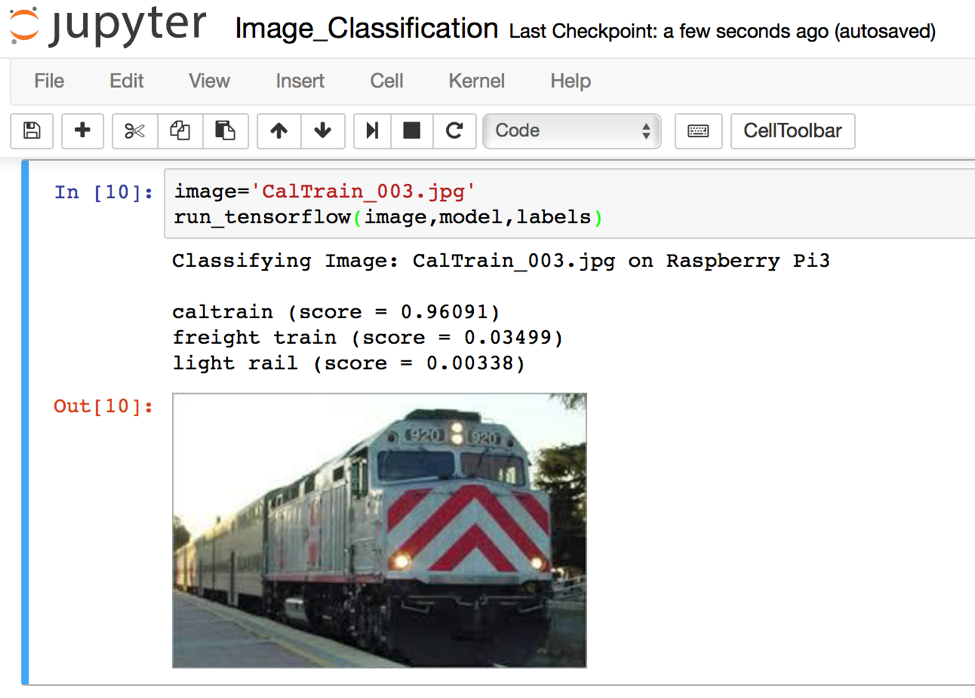
After we were able to detect trains, their speed and their direction, we ran into a new problem: our Pi was not only detecting Caltrains (true positive), but also detecting Union Pacific freight trains and the VTA light rail (false positive). In order to boost our detector’s false positive rate, we used convolutional neural networks implemented in Google’s machine learning TensorFlow library. We implemented a custom Inception-V3 model trained on thousands of images of vehicles to identify different types of trains with >95% accuracy. Matt details this solution in “Recognizing Images on a Raspberry Pi.”
In “Connecting an IoT Device to the Cloud,” Matt shows how we connected our Pi to the cloud using Kafka, allowing monitoring with Grafana and persistence in HBase.
The tools and next steps
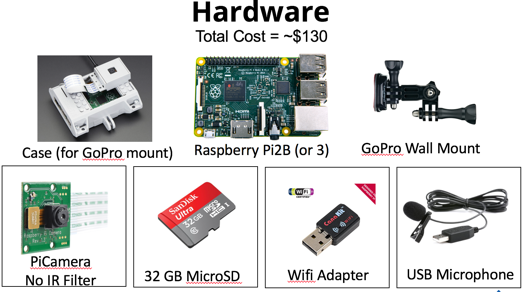
Before we even finished the development on our first device, we wanted to set up more of these devices to get ground truth at other points along the track. With this in mind, we realized that we couldn’t always guarantee that we’d have a speedy internet connection, and we wanted to keep the devices themselves affordable. These requirements make the the Raspberry Pi a great choice. The Pi has enough horsepower to do on-device stream processing so that we could send smaller, processed data streams over internet connections, and the parts are cheap. The total cost of our hardware for this sensor is $130, and the code relies only on open source libraries. In “Building a Deployable IoT Device,” we’ll walk through the device hardware and setup in detail and show you where you can get the code so you can start Trainspotting for yourself.
If you want to learn more about Trainspotting and Data Science at SVDS, stay tuned for our future Trainspotting blog posts, and you can sign up for our newsletter here. Let us know which pieces of this series you’re most interested in.
You can also find our “Caltrain Rider” in the Android and Apple app stores. Our app is built upon the Hadoop Ecosystem including HBase and Spark, and relies on Kafka and Spark Streaming for ingestion and processing of Twitter sentiment and Caltrain API data.
Chloe Mawer comes from a background in geophysics and hydrology, and is well-versed in leveraging data to make predictions and provide valuable insights. Her experience in both academic research and engineering makes her capable of tackling novel problems and creating practical, effective solutions.
Colin Higgins' background is in early-phase Parkinson’s disease drug discovery, wherein he used high-dimensional biophysical datasets to model the effects of dynamic protein structures on drug selectivity. Prior to joining SVDS, he consulted for a startup, developing a user-matching algorithm based on natural language processing.
Matthew Bubashkin comes from a background in optical physics and biomedical research, and has a broad range of experiences in software development, database engineering, and data analytics. He enjoys working closely with clients to develop straightforward and robust solutions to difficult problems.
Original. Reposted with permission.
Related:


