Which Big Data, Data Mining, and Data Science Tools go together?
We analyze the associations between the top Big Data, Data Mining, and Data Science tools based on the results of 2015 KDnuggets Software Poll. Download anonymized data and analyze it yourself.
(co-authored with Shashank Iyer). We took anonymized data from the results of the 2015 KDnuggets Data Mining Software Poll, and performed association analysis the top 20 tools. The dataset consisted of 2759 votes, each for one or more tools. At the bottom of this post there is a link to download the anonymized dataset.
We used a version of Apriori algorithm to analyze the results.
There are many ways to measure how significant is associations between two nominal or binary features, eg chi-square or T-test, but we use a simple measure we call "Lift", defined as
Lift (X & Y) = pct (X & Y) / ( pct (X) * pct (Y) )
where pct(X) is the percent of users who selected X.
Lift (X&Y) > 1 indicates that X&Y appear together more than expected if they were independent,
Lift=1 if X & Y appear with frequency expected if they are independent, and
Lift < 1 if X & Y appear together less than expected (negatively correlated)
Note that this measure is symmetric: Lift (X & Y) = Lift (Y & X)
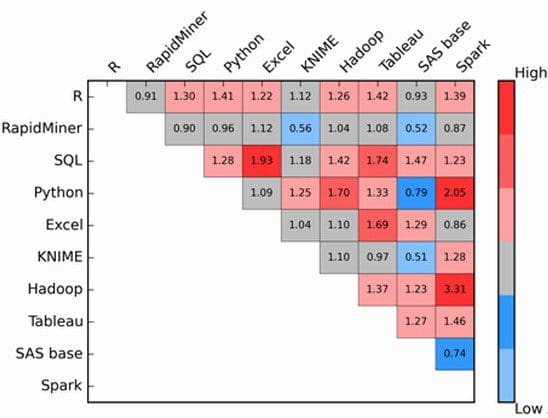
Fig. 1 shows the heat map for the top 10 Data Mining tools. The lift values are displayed in their respective matrix positions and the color gradient represents the degree of association from high to low.
If lift is > 1.2 the square is reddish, if less than 0.8, bluish, else grey.
Spark and Hadoop have the highest association with a lift=3.31, followed by Spark and Python (lift=2.05). We also note strong association between Excel and SQL, and Tableau and SQL.
The lowest associations were found between SAS base and KNIME (0.51), SAS base and RapidMiner (0.52), and KNIME and RapidMiner (0.56).
Fig 1: Association Matrix Heat Map for top 10 most popular data mining tools
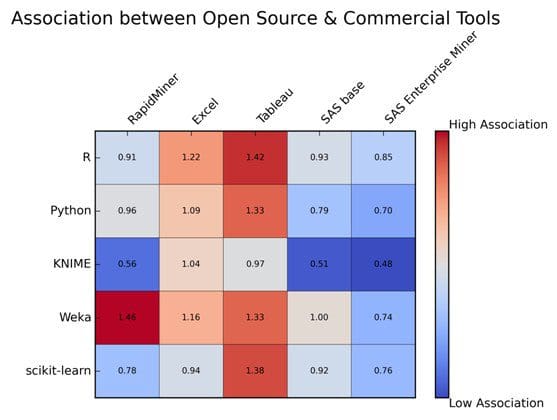
A similar heat map (Fig. 2) was computed showing the various associations between Open Source and Commercial tools.
Fig. 2: Confusion Matrix Heat Map between Open Source and Commercial Tools
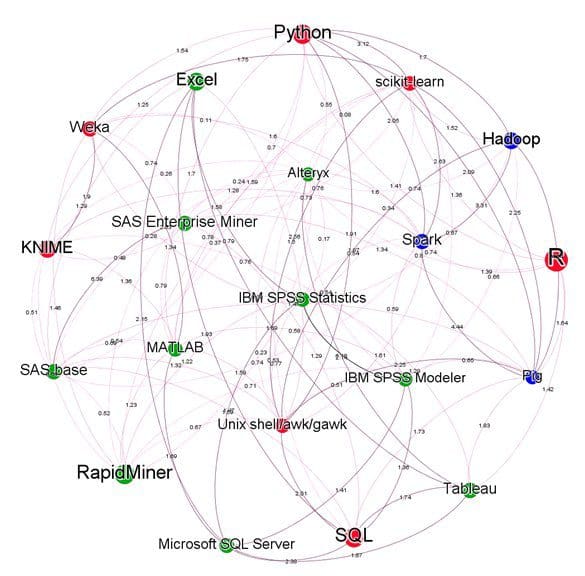
To visualize the correlations between top 20 most popular tools, a network graph was computed as in Fig. 3.
Each node represents a top 20 tool, and the nodes are colored Red: Free/Open Source tools, Green: Commercial tools, Fuchsia: Hadoop/Big Data tools. The node sizes vary based on the percentage of votes each tool received. The edges are broadly categorized into two segments – low association to high association, and this is shown in the steep color gradient from light pink to dark purple respectively. This segmentation is also shown in the weights of each edge, the thicker ones showing a high association and the latter a low association.
Fig. 3: Network graph of top 20 most popular tools (click on the graph to get the higher resolution image
Below are the top, high and low associations highlighting the data in the network graph in fig 3.
Table 1. 20 highest associations (lifts) among top 20 tools
|
Tool X |
Tool Y |
Lift |
| Alteryx | Tableau |
2.14 |
| Excel | Microsoft SQL Server |
2.15 |
| Excel | SQL |
1.93 |
| Hadoop | Spark |
3.31 |
| IBM SPSS Modeler | IBM SPSS Statistics |
6.18 |
| KNIME | Weka |
1.93 |
| MATLAB | Weka |
2.53 |
| Pig | Hadoop |
4.24 |
| Pig | Spark |
4.44 |
| Pig | scikit-learn |
2.25 |
| Pig | Unix shell/awk/gawk |
2.25 |
| Pig | Python |
2.09 |
| Python | scikit-learn |
3.12 |
| Python | Spark |
2.05 |
| Python | Unix shell/awk/gawk |
1.91 |
| SAS base | SAS Enterprise Miner |
6.39 |
| scikit-learn | Spark |
2.63 |
| scikit-learn | Unix shell/awk/gawk |
2.56 |
| SQL | Microsoft SQL Server |
2.38 |
| SQL | Unix shell/awk/gawk |
2.01 |
As can be expected, Excel frequently goes along with SQL, Hadoop with Spark, Pig with Hadoop, IBM SPSS Modeler with IBM SPSS Statistics. Among less obvious associations we see Pig and scikit-learn, and Weka with KNIME and MATLAB.
Table 2. 20 lowest associations (lifts) among top 20 tools
|
Tool X |
Tool Y |
Lift |
| Alteryx | IBM SPSS Modeler |
0.54 |
| Alteryx | IBM SPSS Statistics |
0.17 |
| Alteryx | KNIME |
0.26 |
| Alteryx | MATLAB |
0.37 |
| Alteryx | Python |
0.55 |
| Alteryx | RapidMiner |
0.23 |
| Alteryx | SAS base |
0.28 |
| Alteryx | SAS Enterprise Miner |
0.24 |
| Alteryx | scikit-learn |
0.08 |
| Alteryx | Unix shell/awk/gawk |
0.08 |
| Alteryx | Weka |
0.11 |
| IBM SPSS Modeler | Unix shell/awk/gawk |
0.51 |
| IBM SPSS Statistics | scikit-learn |
0.34 |
| IBM SPSS Statistics | Spark |
0.54 |
| IBM SPSS Statistics | Unix shell/awk/gawk |
0.53 |
| KNIME | SAS base |
0.51 |
| KNIME | SAS Enterprise Miner |
0.48 |
| RapidMiner | SAS base |
0.52 |
| RapidMiner | SAS Enterprise Miner |
0.54 |
Here we see that Alteryx users don't use much else (except Tableau) , IBM SPSS users don't use Unix, and KNIME and RapidMiner users don't use SAS.
Finally, we look at tools that go along with R. Since R was used by almost half the voters, no tool can have association of more than 2, but here are the tools with the highest lifts for R.
Table 3. Tools/Software most associated with R
| Tool | Lift (Tool, R) |
| Hive | 1.54 |
| Tableau | 1.42 |
| Python | 1.41 |
| Spark | 1.39 |
| scikit-learn | 1.36 |
| Unix shell/awk/gawk | 1.32 |
| MATLAB | 1.32 |
| SQLang | 1.30 |
| Weka | 1.30 |
| Microsoft SQL Server | 1.29 |
Here is the link to anonymized data set (CSV format), with 3 columns
- ord: order of the vote
- ntools: number of tools
- votes: tool names, separated by ";". Note: for ease of pattern matching, R is encoded as Rlang, SQL as SQLang.


