Data Cleaning with Pandas
This step-by-step tutorial is for beginners to guide them through the process of data cleaning and preprocessing using the powerful Pandas library.

Image by Author
Introduction
If you are into Data Science, then data cleaning might sound like a familiar term to you. If not, let me explain that to you. Our data often comes from multiple resources and is not clean. It may contain missing values, duplicates, wrong or undesired formats, etc. Running your experiments on this messy data leads to incorrect results. Therefore, it is necessary to prepare your data before it is fed to your model. This preparation of the data by identifying and resolving the potential errors, inaccuracies, and inconsistencies is termed as Data Cleaning.
In this tutorial, I will walk you through the process of cleaning the data using Pandas.
Dataset
I will be working with the famous Iris dataset. The Iris dataset contains measurements of four features of three species of Iris flowers: sepal length, sepal width, petal length, and petal width. We will be using the following libraries:
- Pandas: Powerful library for data manipulation and analysis
- Scikit-learn: Provides tools for data preprocessing and machine learning
Steps for Data Cleaning
1. Loading the Dataset
Load the Iris dataset using Pandas' read_csv() function:
column_names = ['id', 'sepal_length', 'sepal_width', 'petal_length', 'petal_width', 'species']
iris_data = pd.read_csv('data/Iris.csv', names= column_names, header=0)
iris_data.head()
Output:
| id | sepal_length | sepal_width | petal_length | petal_width | species |
| 1 | 5.1 | 3.5 | 1.4 | 0.2 | Iris-setosa |
| 2 | 4.9 | 3.0 | 1.4 | 0.2 | Iris-setosa |
| 3 | 4.7 | 3.2 | 1.3 | 0.2 | Iris-setosa |
| 4 | 4.6 | 3.1 | 1.5 | 0.2 | Iris-setosa |
| 5 | 5.0 | 3.6 | 1.4 | 0.2 | Iris-setosa |
The header=0 parameter indicates that the first row of the CSV file contains the column names (header).
2. Explore the dataset
To get insights about our dataset, we will print some basic information using the built-in functions in pandas
print(iris_data.info())
print(iris_data.describe())
Output:
RangeIndex: 150 entries, 0 to 149
Data columns (total 6 columns):
 #   Column        Non-Null Count  Dtype
---  ------        --------------  -----
 0   id            150 non-null    int64
 1   sepal_length  150 non-null    float64
 2   sepal_width   150 non-null    float64
 3   petal_length  150 non-null    float64
 4   petal_width   150 non-null    float64
 5   species       150 non-null    object
dtypes: float64(4), int64(1), object(1)
memory usage: 7.2+ KB
None
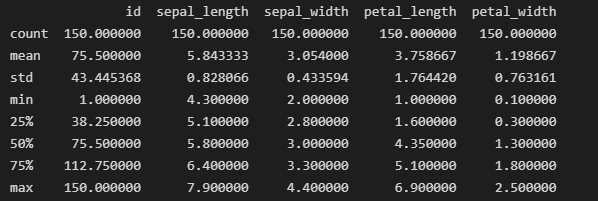
Output for iris_data.describe()
The info() function is useful to understand the overall structure of the data frame, the number of non-null values in each column, and the memory usage. While the summary statistics provide an overview of numerical features in your dataset.
3. Checking Class Distribution
This is an important step in understanding how the classes are distributed in categorical columns, which is an important task for classification. You can perform this step using the value_counts() function in pandas.
print(iris_data['species'].value_counts())
Output:
Iris-setosa        50
Iris-versicolor    50
Iris-virginica     50
Name: species, dtype: int64
Our results show that the dataset is balanced with an equal number of representations of each species. This sets the base for a fair evaluation and comparison across all 3 classes.
4. Removing Missing Values
Since it is evident from the info() method that we have 5 columns with no missing values, we will skip this step. But if you encounter any missing values, use the following command to handle them:
iris_data.dropna(inplace=True)
5. Removing Duplicates
Duplicates can distort our analysis so we remove them from our dataset. We will first check their existence using the below-mentioned command:
duplicate_rows = iris_data.duplicated()
print("Number of duplicate rows:", duplicate_rows.sum())
Output:
Number of duplicate rows: 0
We do not have any duplicates for this dataset. Nonetheless, the duplicates can be removed via the drop_duplicates() function.
iris_data.drop_duplicates(inplace=True)
6. One-Hot Encoding
For categorical analysis, we will perform one-hot encoding on the species column. This step is performed due to the tendency of Machine Learning algorithms to work better with numerical data. The one-hot encoding process transforms categorical variables into a binary (0 or 1) format.
encoded_species = pd.get_dummies(iris_data['species'], prefix='species', drop_first=False).astype('int')
iris_data = pd.concat([iris_data, encoded_species], axis=1)
iris_data.drop(columns=['species'], inplace=True)
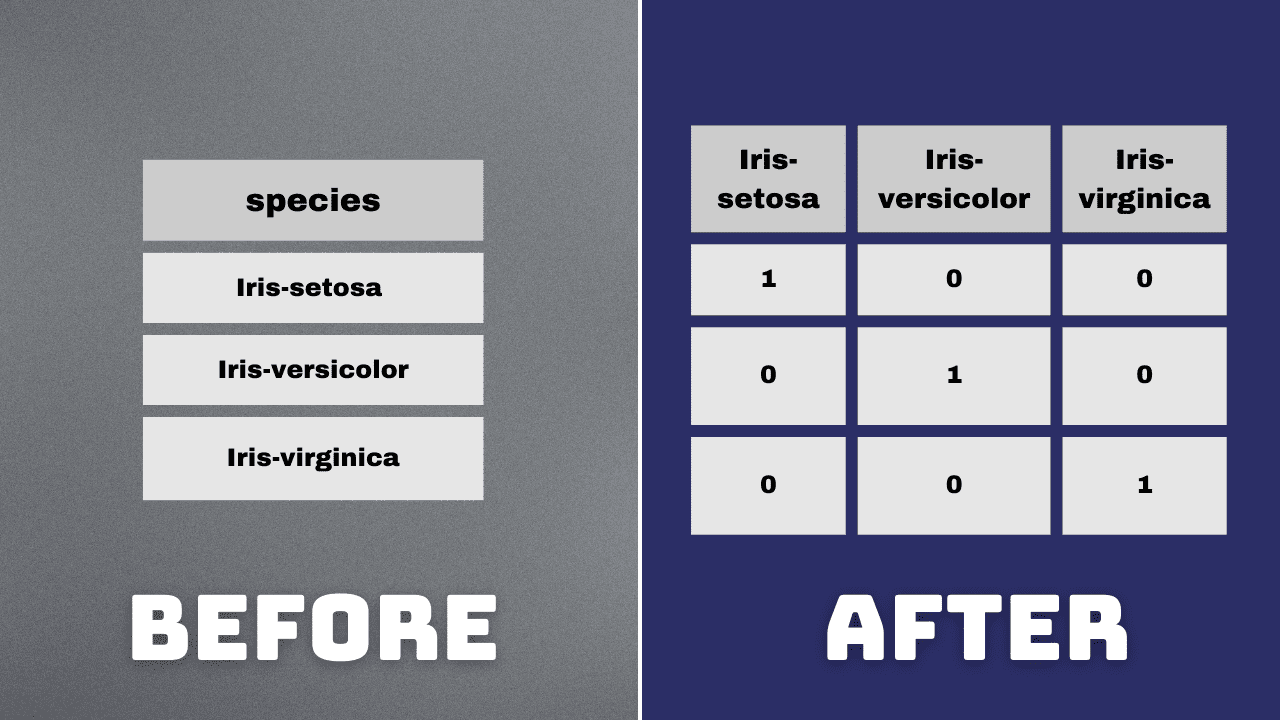
Image by Author
7. Normalization of Float Value Columns
Normalization is the process of scaling numerical features to have a mean of 0 and a standard deviation of 1. This process is done to ensure that the features contribute equally to the analysis. We will normalize the float value columns for consistent scaling.
from sklearn.preprocessing import StandardScaler

scaler = StandardScaler()
cols_to_normalize = ['sepal_length', 'sepal_width', 'petal_length', 'petal_width']
scaled_data = scaler.fit(iris_data[cols_to_normalize])
iris_data[cols_to_normalize] = scaler.transform(iris_data[cols_to_normalize])
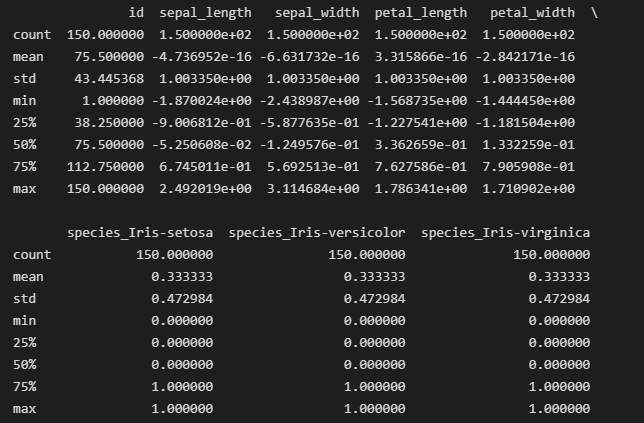
Output for iris_data.describe() after normalization
8. Save the cleaned dataset
Save the cleaned dataset to the new CSV file.
iris_data.to_csv('cleaned_iris.csv', index=False)
Wrapping Up
Congratulations! You have successfully cleaned your first dataset using pandas. You may encounter additional challenges while dealing with complex datasets. However, the fundamental techniques mentioned here will help you get started and prepare your data for analysis.
Kanwal Mehreen is an aspiring software developer with a keen interest in data science and applications of AI in medicine. Kanwal was selected as the Google Generation Scholar 2022 for the APAC region. Kanwal loves to share technical knowledge by writing articles on trending topics, and is passionate about improving the representation of women in tech industry.