Using the apply() Method with Pandas Dataframes
Explore ways in which you can use apply () method to do different activities in a DataFrame.

Photo by Pakata Goh on Unsplash
In this tutorial we will cover the following:
1) Understanding apply() method in Python and when it is used
2) Implementing apply() method on a Pandas Series
3) Implementing apply() method on a Pandas Data Frame
4) Implementing apply() method to solve four use cases on a Pandas Data Frame
5) Conclusion
Understanding apply() Method in Python and When it is Used?
The apply() method is mostly used for data cleaning where it focusses on applying the method on every element in a pandas Series and for every row/column of a pandas Data Frame.
Let us get started
Implementing apply() Method on a Pandas Series
Series are one-dimensional arrays which have axis labels named indices and consist data of different types such as strings, integers and other Python objects too.
Let's implement a Series object having two lists which contain planets as indices and their diameter in kilometers as data
Code:
import pandas as pd

import numpy as np

planetinfo = pd.Series(data=[12750, 6800, 142800, 120660],
                       index=["Earth", "Mars", "Jupiter", "Saturn"])

planetinfo
Output:

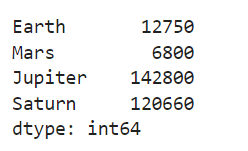
The code above returns a planetinfo object and its corresponding data type. Since the data type of object is series, let's see how we can convert the diameter in km of every planet to miles using the apply() method
Code:
def km_to_miles(data):
  return 0.621371 * data

print(planetinfo.apply(km_to_miles))
Output:

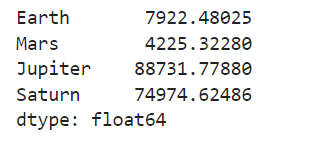
The above code returned the conversion of every planet's diameter from km to miles. In order to do that, we first defined a function named km_to_miles(), then we passed the function without any parenthesis to the apply() method. The apply() method then took every data point in the series and applied the km_to_miles() function on it.
Implementing apply() Method on a Pandas Data Frame
We will now create a dummy Data Frame in order to understand how we can use the apply () method for row and column manipulation in Data Frame. The dummy Data Frame which we are going to create contains the details of students using the following code:
Code:
studentinfo=pd.DataFrame({'STUDENT_NAME':["MarkDavis","PriyaSingh","KimNaamjoon","TomKozoyed","TommyWalker"],
                         "ACADEMIC_STANDING":["Good","Warning","Probabtion","Suspension","Warning"],
                         "ATTENDANCE_PERCENTAGE":[0.8,0.75,0.25,0.12,0.30],
                         "MID_TERM_GRADE": ["A+","B-","D+","D-","F"]})

studentinfo
Output:

We now have created a dummy Data Frame named studentinfo and will learn how to implement the apply() method by exploring 4 different use cases. Every use case will be new and will be solved by using the apply() method
Usecase_1
As a part of the data cleaning check we will be inspecting whether all the values in column STUDENT_NAME are only alphabets. In order to do that we will define a function named datacheck() that gets the STUDENT_NAME column and returns True or False by using the isalpha() method. The result's True or False will be then returned inside a new column named IS_ALPHABET in the studentinfo Data Frame
Code:
def datacheck(data):
  if data.isalpha():
   return True
  else:
   return False
Now we will apply the datacheck() function on the STUDENT_NAME column of the studentinfo Data Frame by implementing the apply() method.
Code:
studentinfo["IS_ALPHABET"] = studentinfo["STUDENT_NAME"].apply(datacheck)
studentinfo
Output:

We can see how the datacheck() function is applied on each row of the STUDENT_NAME column and the results returned are stored in a new column named IS_ALPHABET
Usecase_2
As a part of another data cleaning check we will be reducing the cardinality of the column ACADEMIC_STANDING where we will label the Category Good to ACADEMIC_STANDING_GOOD and rest of the categories to ACADEMIC_STANDING_BAD.
To implement this use case we will define a function named reduce_cardinality() which gets the column ACADEMIC_STANDING. Inside the function, ifstatement is going to be used for comparison check hence returning the results ACADEMIC_STANDING_GOOD and ACADEMIC_STANDING_BAD to the ACADEMIC_STANDING column.
Code:
def reduce_cardinality(data):
  if data != "Good":
   return "ACADEMIC_STANDING_BAD"
  else:
   return "ACADEMIC_STANDING_GOOD"
Now we will apply the reduce_cardinality() function on the ACADEMIC_STANDING column of the studentinfo Data Frame by implementing the apply() method.
Code:
studentinfo["ACADEMIC_STANDING"]=studentinfo["ACADEMIC_STANDING"].apply(reduce_cardinality)

studentinfo
Output:

We can see how the reduce_cardinality() function is applied on each row of the ACADEMIC_STANDING column where the original values inside the ACADEMIC_STANDING column have now been modified to two distinct categories which are ACADEMIC_STANDING_BAD and ACADEMIC_STANDING_GOOD hence reducing the cardinality in the data
Usecase_3
For this use case again we will be reducing the cardinality of the column MID_TERM where we will label the grades starting with A,B,C as Corhigher and grades starting with D,F,W as Dorlower
To implement this use case we will define a function named reduce_cardinality_grade() which gets the column MID_TERM_GRADE. Inside the function , ifstatement and ()startswith method are going to be used for comparison check hence returning the results Corhigher and Dorlower to the MID_TERM_GRADE column.
Code:
def reduce_cardinality_grade(data):
  if data.startswith('A'):
   return "Corhigher"
  elif data.startswith('B'):
   return "Corhigher"
  elif data.startswith('C'):
   return "Corhigher"
  else:
   return "Dorlower"
Now we will apply the reduce_cardinality_grade() function on the MID_TERM_GRADE column of the studentinfo Data Frame by implementing the apply() method.
Code:
studentinfo["MID_TERM_GRADE"]=studentinfo["MID_TERM_GRADE"].apply(reduce_cardinality_grade)

studentinfo
Output:

We can see how the reduce_cardinality_grade() function is applied on each row of the MID_TERM_GRADE column where the original values inside the MID_TERM_GRADE column have now been modified to two distinct categories which are Corhigher and Dorlower hence reducing the cardinality
Usecase_4
For this use will be creating a new column named FINAL_GRADE_STATUS inside the function check() where the values inside the FINAL_GRADE_STATUS will be determined on the following two conditions:
1) If the student's ATTENDANCE_PERCENTAGE is >= 0.6 and MID_TERM_GRADE is Corhigher than the FINAL_GRADE_STATUS will be flagged as High_Chance_Of_Passing
2) If the student's ATTENDANCE_PERCENTAGE is < 0.6 and MID_TERM_GRADE is Dorlower than the FINAL_GRADE_STATUS will be flagged as Low_Chance_Of_Passing
Inside the function the comparison check will be done by using the ifstatement, and operator in Python
Code:
def check(data):
  if (data["ATTENDANCE_PERCENTAGE"] >= 0.6) and (data["MID_TERM_GRADE"] == "Corhigher"):
   return "High_Chance_Of_Passing"
  elif (data["ATTENDANCE_PERCENTAGE"] < 0.6) and (data["MID_TERM_GRADE"] == "Dorlower"):
   return "Low_Chance_Of_Passing"
Now we will apply the checking function on the ATTENDANCE_PERCENTAGE, MID_TERM_GRADE columns of the studentinfo Data Frame by implementing the apply() method. The axis=1 argument means to iterate over rows in the Data Frame.
Code:
studentinfo["FINAL_GRADE_STATUS"]=studentinfo[["ATTENDANCE_PERCENTAGE","MID_TERM_GRADE"]].apply(check,axis = 1)

studentinfo
Output:

We can see how the check() function is applied on each row of the MID_TERM_GRADE and ATTENDANCE_PERCENTAGE columns hence returning a new column named FINAL_GRADE_STATUS with values Corhigher and Dorlower .
Conclusion
In this tutorial, we understood how to use the apply() method by exploring different use cases. apply() method gives user the ability to perform different types of data manipulation on every value of a Series or pandas Data Frame
Priya Sengar (Medium, Github) is a Data Scientist with Old Dominion University. Priya is passionate about solving problems in data and converting them into solutions.
