3 Tools to Track and Visualize the Execution of Your Python Code
Avoid headaches when debugging in one line of code.
Motivation
Have you ever seen an error output like below:
2 divided by 1 is equal to 2.0.
Traceback (most recent call last):
  File "loguru_example.py", line 17, in <module>
    divide_numbers(num_list)
  File "loguru_example.py", line 11, in divide_numbers
    res = division(num1, num2)
  File "loguru_example.py", line 5, in division
    return num1/num2
ZeroDivisionError: division by zero
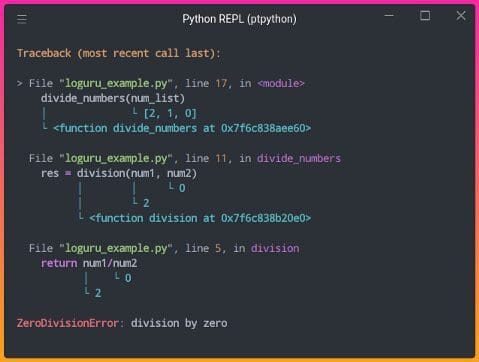
and wish the output can be a little bit easier to understand as shown here?

Image by Author
You might also want to visualize which lines of code are being executed and how many times they are executed in real-time:

GIF by Author
If so, this article will give you the tools to do exactly the above. Those 3 tools are:
- Loguru — print better exceptions
- snoop — print the lines of code being executed in a function
- heartrate — visualize the execution of a Python program in real-time
And all it takes to use these tools is one line of code!
Loguru — Print Better Exceptions
Loguru is a library that aims to make logging in Python enjoyable. Loguru provides many interesting functionalities, but one functionality that I found to be the most helpful is the ability to catch unexpected errors and display which value of a variable causes your code to fail.
To install Loguru, type
pip install loguru
To understand how Loguru can be useful, imagine that you have 2 functions division and divide_numbersand the function divide_numbers is executed.
Note that combinations([2,1,0], 2) returns [(2, 1), (2, 0), (1, 0)] . After running the code above, we get this error:
2 divided by 1 is equal to 2.0.
Traceback (most recent call last):
  File "loguru_example.py", line 17, in <module>
    divide_numbers(num_list)
  File "loguru_example.py", line 11, in divide_numbers
    res = division(num1, num2)
  File "loguru_example.py", line 5, in division
    return num1/num2
ZeroDivisionError: division by zero
From the output, we know that the line return num1/num2 is where the error occurs, but we don’t know which values of num1 and num2 cause the error. Luckily, this can be easily tracked by adding Loguru’s logger.catch decorator:
Output:

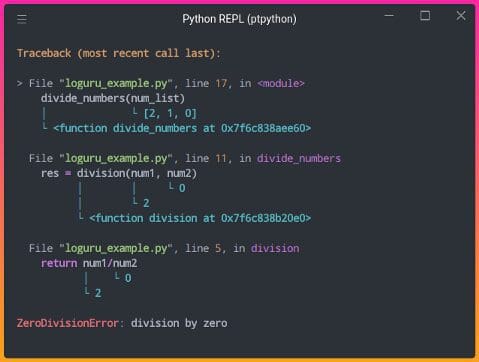
Image by Author
By adding logger.catch, the exceptions are much easier to understand! It turns out that the error occurs when dividing 2 by 0.
snoop — Print the Lines of Code being Executed in a Function
What if there is no error in the code, but we want to figure out what is going on in the code? That is when snoop comes in handy.
snoop is a Python package that prints the lines of code being executed along with the values of each variable by adding only one decorator.
To install snoop, type:
pip install snoop
Let’s imagine we have a function calledfactorial that finds the factorial of an integer.
Output:
The factorial of 5 is 120
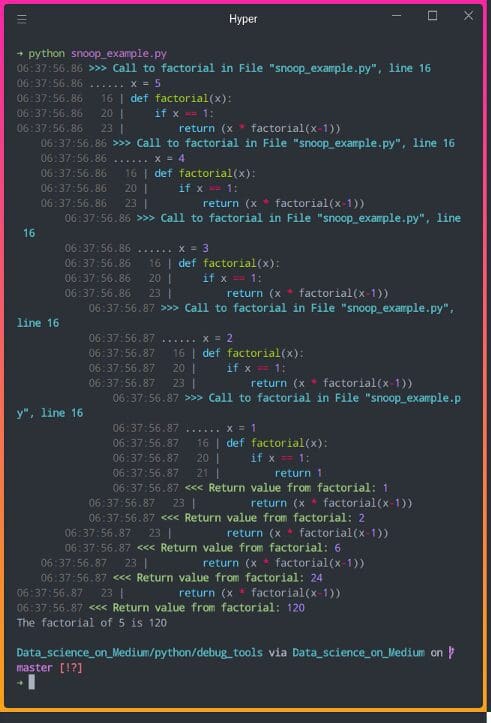
To understand why the output of factorial(5) is 20 , we can add snoop decorator to the function factorial .
Output:

Image by Author
In the output above, we can view the values of the variables and which lines of code are executed. Now we can understand how recursion works much better!
heartrate — Visualize the Execution of a Python Program in Real-Time
If you want to visualize which lines are executed and how many times they are executed, try heartrate.
heartrate is also created by the creator of snoop. To install heartrate, type:
pip install heartrate
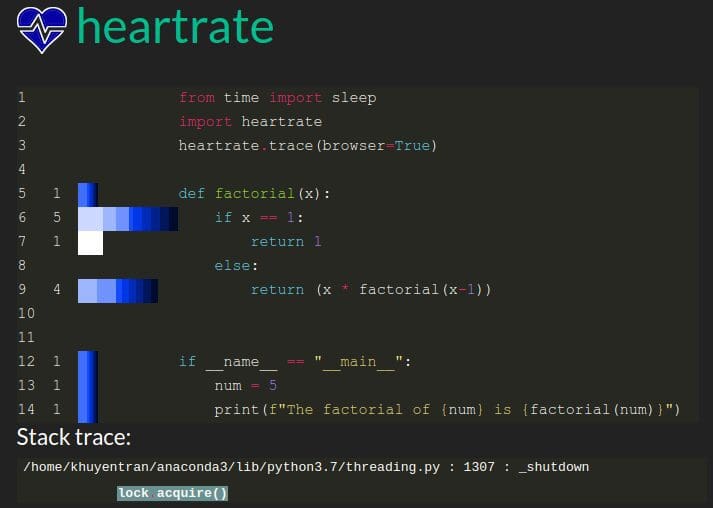
Now let’s add heartrate.trace(browser=True) to our previous code. This will open a browser window displaying the visualization of the file where trace() was called.
A new browser should pop up when you run the code above. If not, go to http://localhost:9999. You should see the output like below:

Image by Author
Cool! The bars show the lines that have been hit. The longer bars mean more hits, lighter colors mean more recent.
From the output above, we can see that the program executes:
if x==15 timesreturn 1oncereturn (x * factorial(x-1))4 times
The output makes sense since the initial value of x is 5 and the function is called repetitively until x equals to 1 .
Now let’s see what it is like to visualize the execution of a Python program in real-time using heartrate. Let’s add sleep(0.5) so that the program runs a little bit slower and increase num to 20 .

GIF by Author
Awesome! We can see which lines of code are being executed and how many times each of them has been executed in real-time.
Conclusion
Congratulations! You have just learned 3 tools to track and visualize the execution of your Python code. I hope debugging will be less painful for you when using these 3 tools. Since these tools only require one line of code, why not give them a try to see how helpful they are?
Feel free to play and fork the source code of this article here.
Star this repo.
Khuyen Tran is a prolific data science writer, and has written an impressive collection of useful data science topics along with code and articles. Khuyne is currently looking for a machine learning engineer role, a data scientist role, or a developer advocate role in Bay Area after May 2022, so please reach out if you are looking for someone with her set of skills.
Original. Reposted with permission.
